
Apinizer — Our API Gateway module is the backbone of our API Management & Integration Platform. We discussed why you might need this module in our previous article.
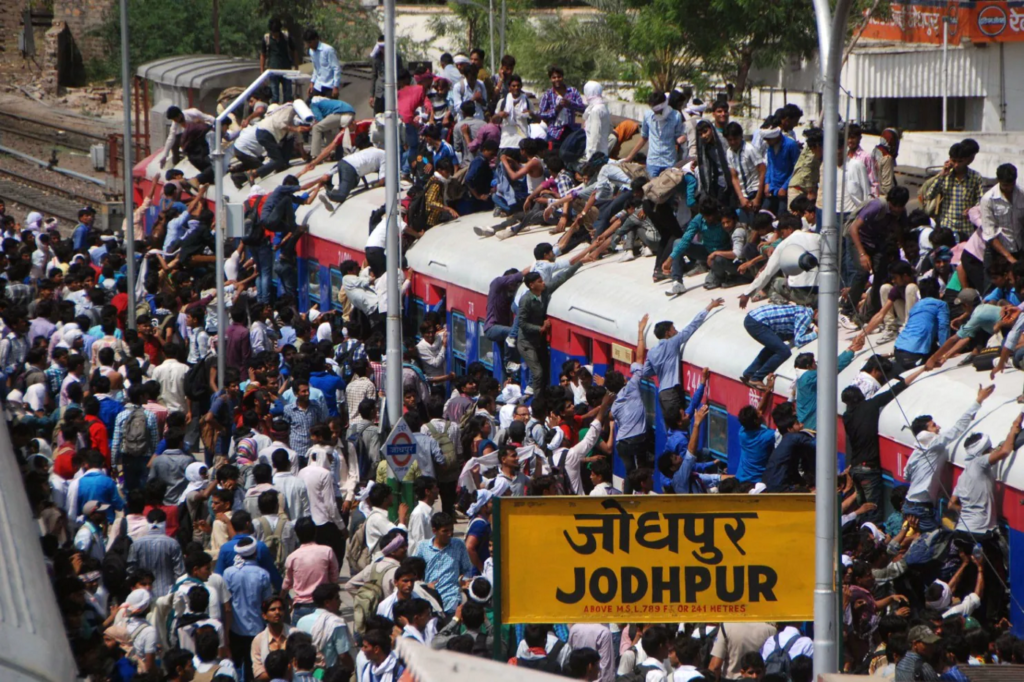
When we compared API Gateway to a train carrying messages, we started to get the passengers to the train to get answers to the questions such as “How many passengers can fit on this train?”, “How fast and how far can the train go?” 🙂
It is also stated that there can be a “Single Point of Failure” as API Gateways are the point where services are gathered at the entrance and the center (Single Point of Entry). Therefore, their performance should be high and “High Available”. With the help of Kubernetes (we discussed it on this article), it provides a “High Available” service, and its performance is the main topic of this article.
Since Apinizer uses Java in its infrastructure, there may be a prejudice that the application may be slow. Those who claim that Java is “slow” may argue that the Gateway part should be written in languages such as C and Go. Although there are many comparisons on this subject, I want to say “it depends” according to usage, needs, and experience. Since this topic includes many parameters such as coding, extensibility, security, coding speed, and so on, I return to our topic by saying it is a series of articles on its own.
Apinizer would use Oracle implementations as a Java version in its infrastructure, until the day that Java versions started to increase at an unbeatable rate. 🙂 After trying different JVMs, we preferred the Eclipse OpenJ9 implementation due to both high performance and low resource consumption. I think that this choice is really beneficial for us, especially in terms of resource consumption. I think the results will also support me.
Before moving on to the load testing results, I need to state that Apinizer works on Kubernetes and that it can manage Kubernetes through Kubernetes’ APIs.
To simulate the real environment, we created an architecture that we also installed Kubernetes as follows:
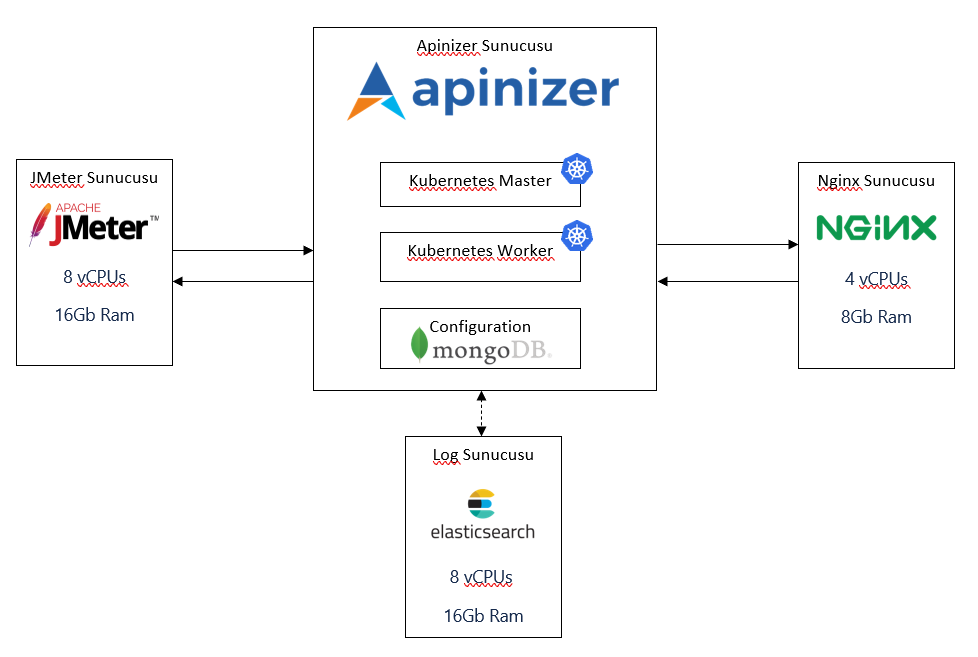
We rented servers suitable for this architecture from DigitalOcean. For servers, we used the configurations in the CPU-Optimized option. We installed the Apinizer by configuring the Kubernetes master and worker machines on the droplet we configured, not using the Kubernetes service provided by DigitalOcean to suit the real customer scenario. You can visit this page for detailed installation.
For the load test, we made different configurations to the environment we created via Apinizer. If you want to learn how we did the configurations, you can visit this page.
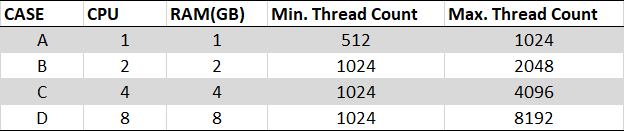
I can summarize the resources we have given for the Pod, where the Gateway module is installed, in the table below:
What we pay attention to when testing:
First of all, a very common mistake when examining the results is to confuse the number of sessions with the number of instant requests. So let me clear this issue; a request is an HTTP request for a specific destination with a specific HTTP method. There can be zero or more requests per session. For example, having a 50K session in a web application does not mean that there will be 50K instant requests, and the probability of 50K request at the same time is very low. Holding session on gateways is very rare and access to services is usually stateless. Therefore, it becomes more meaningful to measure the number of simultaneous requests and latency.
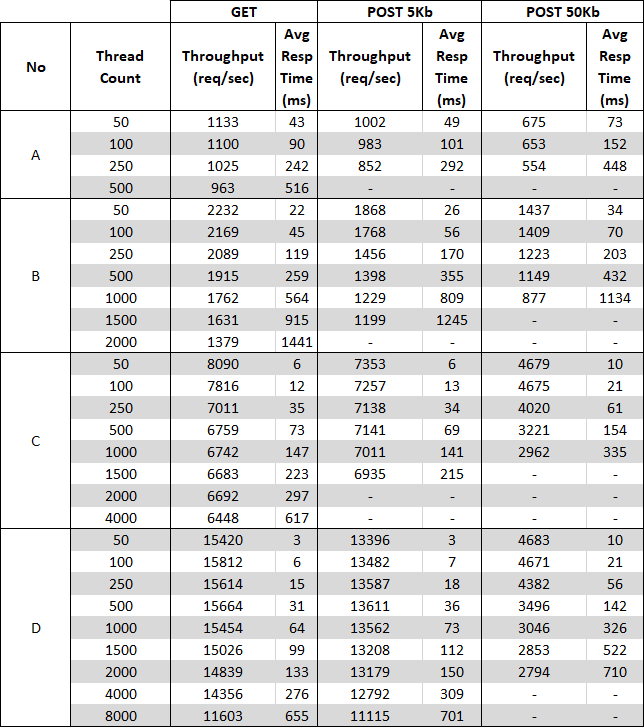
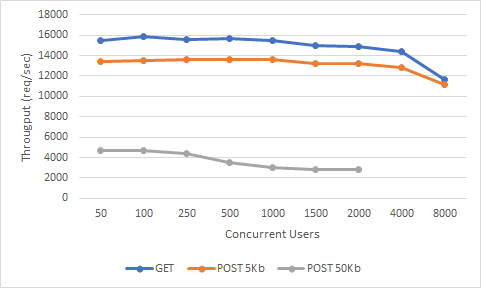
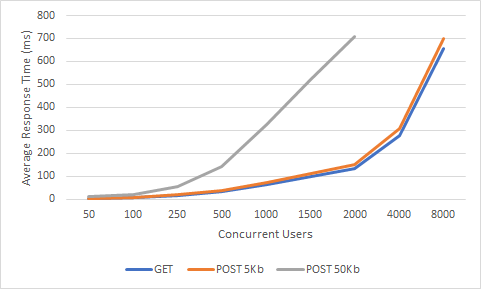
When the number of simultaneous users increases, the efficiency increases up to a certain limit. Then it starts to decline. This natural course indicates that there is a limit to vertical growth. To support more concurrent users with acceptable response times, horizontal or vertical scaling must be considered together. When scaling horizontally, while other Gateways need to put a load balancer in front of two or more Gateways, Apinizer uses Kubernetes infrastructure so this can be configured very easily and quickly.
As the message sizes increase, the processing power requirement will increase and the efficiency decreases. Therefore, the response time is also longer. Although request sizes are usually around 1KB in real-life scenarios, we found it worth examining 5KB and 50KB POST requests, as there was little difference between our 1KB POST and GET requests in our tests. Although the results are naturally lower than the GET requests, we were pleased that the figures dropped to only one-fourth of the data, which increased by 10 times.
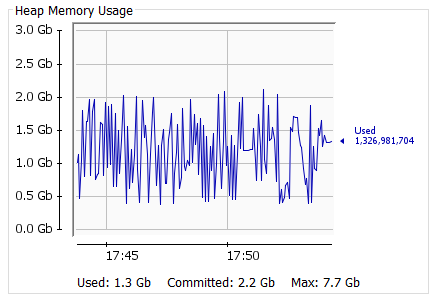
Percentages of RAM consumed throughout the load test were very consistent. Although the size of requests increased tenfold, there was no significant increase in RAM usage. This proved that Openj9 is the right choice.
Snapshot of VM for “D” State, 8000 Thread, GET request:
Back at the beginning of our article, we compared API Gateway to a train, and we measured the performance of this train’s locomotive. If we add another wagon to the train, its performance will be affected according to the load of the added wagon. In the same way, each policy we add to Gateway affects performance according to its complexity and dependencies.
Now let’s add a “basic authentication” policy to Apinizer. Let’s test this configuration only for the “D” state, not for all states. It will give you an idea after all:
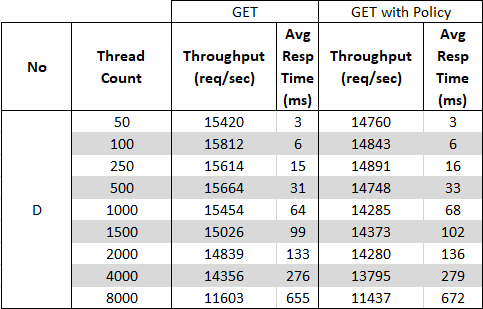
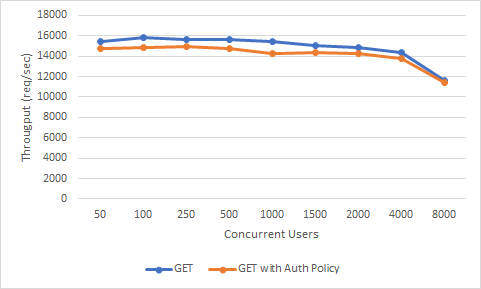
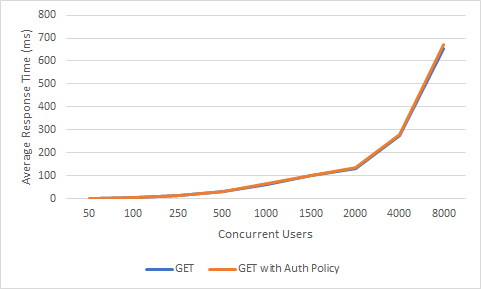
As we can see, the effect on the performance has been insignificant. However, if a policy with high processing power such as “content filtering” was added, or a policy such as “LDAP Authentication” that requires external connection and adds network latency, performance would decrease even more rapidly.
So are we not going to use any policies at all? Of course, we will, but the important thing here is to know how much load each wagon will bring and to choose the locomotive accordingly. In this sense, since each policy of Apinizer is written in a way that will be the most performant and secure in itself, it will make you much more advantageous than the “Code way” rather than API Gateway.
Input your search keywords and press Enter.