
In the first section of the “Elasticsearch Usage” article series, I talked about why we chose Elasticsearch in Stage 1 and the settings we applied as a result of the literature review with Elasticsearch in Stage 2. In this article, we conducted tests to evaluate the issues that leave a question mark on the performance effect of the index theme.
Elasticsearch Usage with Apinizer – Part:1
Stage 1: Couchbase & InfluxDb & Elasticsearch, which one is the right decision for us?
Stage 2: What is the right Elasticsearch setting for us?
Elasticsearch Usage with Apinizer – Part:2 (this article)
Stage 3: Performance Tests
Elasticsearch Usage with Apinizer – Part:3
Stage 4: Shard and Disk Size
Stage 5: Crucial Checks
We decided to test some cases to measure what the impact will be and how much of an impact it will have on performance. Because researches and recommendations focused on modeling the document structure to be the cheapest and searching on as few fields as possible. We have shortened the situations (our curiosities) to be tested as follows;
Case 1: What effect will the _source and index mapping parameters have on disk space and query speed? What is the difference between index in default mapping and index with these parameters?
Case 2: What are the changes in the results on Case1 over 10M documents and what are the differences in the measured values when indexing with default settings?
Case 3: Is there any difference between index with custom template and index created with default settings?
Case 4: Is Elasticsearch performance really good on loaded data?
📓 Note: When handling these cases, they should not be compared, as different criteria are intended to measure and different document structures are used.
Index size and disk size comparison will be made on indexes where the index mapping parameter is true and false.
To test this situation, an index with two different mappings as case1condition1 and case1condition2 was created. The mapping of these indexes is as follows;
A sample document for the case1condition1 and case1condition2 indexes;
# The text in the message1 and message2 fields is 500 characters
{
"message1":"But I must explain to you how all this mistaken idea of denouncing pleasure and praising pain was born and I will give you a complete account of the system, and expound the actual teachings of the great explorer of the truth, the master-builder of human happiness. No one rejects, dislikes, or avoids pleasure itself, because it is pleasure, but because those who do not know how to pursue pleasure rationally encounter consequences that are extremely painful. Nor again is there anyone who loves or.",
"message2":"But I must explain to you how all this mistaken idea of denouncing pleasure and praising pain was born and I will give you a complete account of the system, and expound the actual teachings of the great explorer of the truth, the master-builder of human happiness. No one rejects, dislikes, or avoids pleasure itself, because it is pleasure, but because those who do not know how to pursue pleasure rationally encounter consequences that are extremely painful. Nor again is there anyone who loves or.",
"age":20
}
The following queries were run on these indexes:
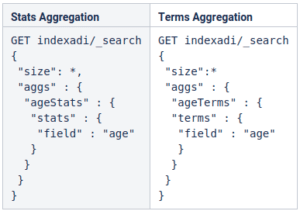
* The value of the size parameter in the query was queried separately by giving 0 and 20 values.
Query results and index size run on 500 thousand documents
| Index Case1 | Condition1 | Condition2 | ||
| Index Size (mb) | 49 | 51 | ||
| Stats Aggregation | Size:20 | First Execution | 33 ms | 39 ms |
| Cached Execution | 43 ms | 45 ms | ||
| Size:0 | First Execution | 36 ms | 32 ms | |
| Cached Execution | 2 ms | 1 ms | ||
| Terms Aggregation | Size:20 | First Execution | 84 ms | 86 ms |
| Cached Execution | 2 ms | 2 ms | ||
| Size:0 | First Execution | 44 ms | 29 ms | |
| Cached Execution | 2 ms | 2 ms | ||
In conclusion;
In this section, a retest was carried out on indexes with 10M documents to measure the performance of the other most used Term and Match queries and to find an answer to the question of “What is the difference between the disk size and search performances of case1condition1 and case1condition2 indexes and the index with default mapping when the number of documents increases in Case1?”
The following queries were run on the case2condition1, case2condition2, and case2condition3 indexes.
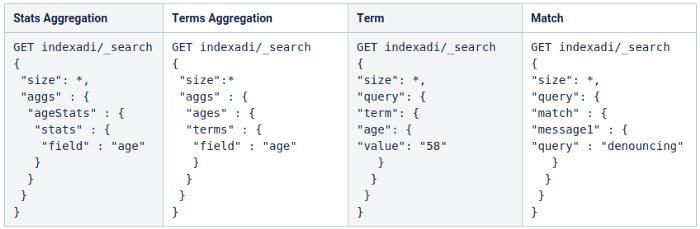
* The value of the size parameter in the query was queried separately by giving 0 and 20 values.
Query results and index size run on 10 million documents;
| Case2 | Condition1 | Condition2 | Condition3 | ||
| Index Size (mb) | 1017.33 | 1027.79 | 1254.84 | ||
| Stats Aggregation | Size:20 | First Execution | 1223 ms | 619 ms | 1206 ms |
| Cached Execution | 1082 ms | 568 ms | 1175 ms | ||
| Size:0 | First Execution | 481 ms | 417 ms | 450 ms | |
| Cached Execution | 2 ms | 3 ms | 2 ms | ||
| Terms Aggregation | Size:20 | First Execution | 1116 ms | 907 ms | 1214 ms |
| Cached Execution | 1067 ms | 894 ms | 1170 ms | ||
| Size:0 | First Execution | 429 ms | 411 ms | 437 ms | |
| Cached Execution | 2 ms | 3 ms | 2 ms | ||
| Term Query | Size:20 | First Execution | * | 41 ms | 19 ms |
| Cached Execution | 12 ms | 15 ms | |||
| Size:0 | First Execution | 20 ms | 4 ms | ||
| Cached Execution | 2 ms | 2 ms | |||
| Match Query | Size:20 | First Execution | 40 ms | 9 ms | 12 ms |
| Cached Execution | 5 ms | 3 ms | 10 ms | ||
| Size:0 | First Execution | 1 ms | 2 ms | 4 ms | |
| Cached Execution | 1 ms | 1 ms | 2 ms | ||
* Term query could not run a query on age because the index value was false.
In conclusion;
Comparison of an index with custom template and index created with default settings
All the completed operations so far consist of research and tests on what settings we will make to optimize disk size and run more performance queries. Under this situation, we tried to measure what we gained or lost by comparing the case3condition1 index with the mapping we created and the case3condition2 index in the default settings. These indexes have 1 million documents.
To test this case, a template named case3condition1template was created, which includes the mapping and settings of case3condition1. For the case3condition2 index, there is no need for any template as indexing will be done in the default settings. Elasticsearch indexes with default mapping values and settings. These indexes are;
Click here for mapping of the case3condition1 index
Click here for mapping of the case3condition2 Index
It was tested on these indexes with a more complex aggregation and full-text query suitable for real use. Unshortened domain names were used in the queries made on the case3condition2 index. These queries are;
Click here for Complex Query
Click here for Complex Full-Text Query
Query results and index size run on 1 million documents;
| Case3 | Condition1 | Condition2 | ||
| Index Size (gb) | 2 | 2.6 | ||
| Complex Query | Size:0 | First Execution | 194 ms | 317 ms |
| Cached Execution | 130 ms | 130 ms | ||
| Complex Full-Text Query | Size:20 | First Execution | 180 ms | 260 ms |
| Cached Execution | 22 ms | 21 ms | ||
In conclusion;
Our work seems to serve the purpose. 😸 The elasticsearch cluster on our platform is operational as both a time-series database and a full-text-search database.
Is Elasticsearch performance really good on loaded data?
We tested the query speeds on the index with 550M documents.
To test this situation, an index with mapping to the case4condition1 index was created. The mapping and an example document of this index is as follows;
The following queries were run on the case4condition1 index;
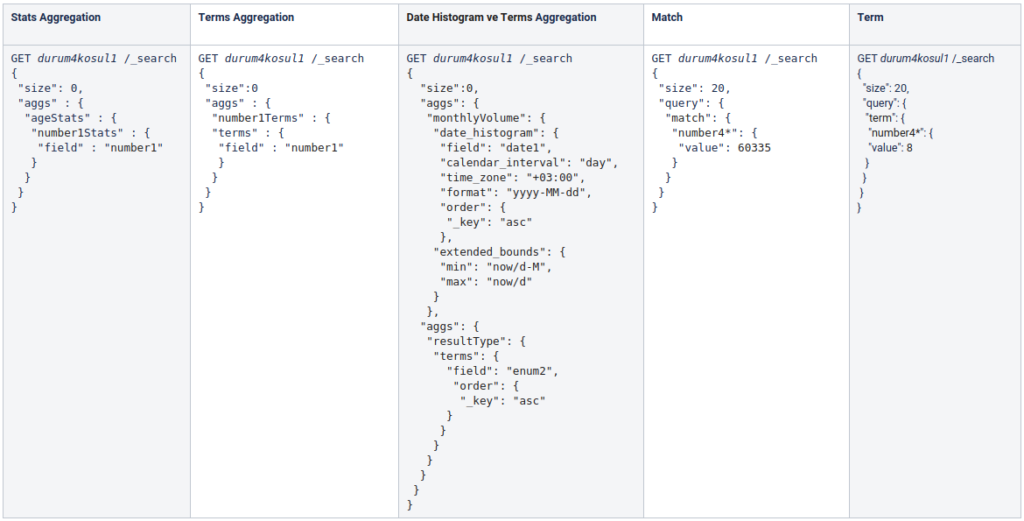
* The value assigned to the field name and value property in this query differs according to the data type.
The results of the queries run on the case4condition1 index, which has 550 million documents and has a size of 96.3GB;
| Query Type | Field Name | First Execution (ms) | Cached Execution (ms) |
| Stats Aggregation | number1 | 20384 | 2 |
| Terms Aggregation | number1 | 21858 | 2 |
| Date Histogram and Terms Aggregation | date1, enum2 | 28536 | |
| Match Query | metin1 | 143 | 5 |
| metin2 | 210 | 6 | |
| enum1 | 67 | 4 | |
| enum2 | 64 | 3 | |
| number1 | 979 | 830 | |
| number2 | 234 | 152 | |
| number3 | 204 | 52 | |
| number4 | 96 | 12 | |
| Term Query | metin1 | 122 | 5 |
| metin2 | 164 | 11 | |
| enum1 | 6 | 4 | |
| enum2 | 3 | 2 | |
| number1 | 856 | 828 | |
| number2 | 227 | 154 | |
| number3 | 102 | 46 | |
| number4 | 59 | 5 |
In conclusion;
Input your search keywords and press Enter.