

What do the two comic book heroes above have in common, other than their clothed, cool, and tough stances?
Without further ado: Batman watches Gotham and Heimdall watches and listens to the Nine Realms. Batman is undoubtedly a bit more popular, Heimdall is somewhat overshadowed by Thor (in fact, I think Heimdall is more charismatic), but these are irrelevant for our case. The important thing is: they are both WATCHING and LISTENING so they can intervene immediately if a problem arises.
When you do this monitoring and listening work for API/Web Services, and if there is a problem, when you inform someone instead of beating those in charge (!), this is called API Monitoring.
As I mentioned in my previous post, while addressing the API Gateway issue, I will use the terms API and Web Service in the same sense in this article, regardless of the small differences between them. Additionally, the “endpoints” of the service are mentioned when working with REST, and the “methods” when working with SOAP. Let me also state that I will call all of them “methods”.
We would like to have such superheroes for us developers. One of them is to watch and listen to every written API/Web Service, even systems that do not have a Web Service. In case of an error, let him handle the issue, solve the problem and keep everything on track. Let us never get a headache and never know what’s going on. But of course, there are no charismatic heroes with these superpowers in real life, nor do they exist in the API world. Therefore, instead of waiting for the heroes to do API Monitoring, we should do it ourselves.
Is there anyone saying “Well, why would there be a need for such monitoring and listening? After all, we wrote the code, tested it, went live, and the clients have been using it for a while now. We haven’t had any issues so far.” Admit it, something like this has passed through your mind, right? That’s why, first, I want to seek answers to your questions like “What is API Monitoring? Is it really necessary?” through possible scenarios and then I would like to tell you a few methods for those who say “How can we do this?”
Every developer tests the code they write first. I’m passing methods like TDD up. Even if you’re just learning to program, you run the code you wrote first, enter a few different values, and see if it works and if it’s doing its job correctly. The situation is not different when developing API/Web Service. Detailed and repetitive tests are carried out with systematic and professional methods, or at least a request is sent to the running service and it is checked whether it can be accessed and whether it returns the expected value. After the tests are done, the necessary information such as access address, user information, documentation is given to the clients, and the API / Web Service is put into service.
So, what’s the point of watching the services we open after all these tests?
I list a few scenarios that immediately come to mind:
1- An unpredictable situation occurs in the tests and an error may be returned to a specific client from time to time or maybe constantly due to the data contained in the parameter it sends.
2- Your server has slowed down for some reason, as a result, even though the API/Web Service is algorithmically OK, it is timing out and your clients are getting errors frequently.
3- API/Web Service becomes a client to one or more Web Services and uses the data returned from them. Even if your service is running, timeout or failure to respond to any of the services you are a client to is reflected outside as your service’s inability to respond.
4- Network settings may have been changed, so your service may have become inaccessible.
5- Your server may have become unable to serve in some way. In this case, it doesn’t matter how well your API/WebService works, because your clients cannot access it.
6- Let’s assume API/Web Service is returning or updating data in a database. As soon as a sloppy developer of another application that uses/feeds the same database changes the table structure, some of your service’s methods may start crashing. I can say that it is a problem that occurs more often than you expect, especially for the systems under development.
You can think of other scenarios. You can be sure, these are situations that can happen, and everyone who works with Web Services encounters these or similar situations from time to time. If you notice, most of the items consist of situations that cannot be caught by tests. On the other hand, you can be sure that not that detailed testing has been developed for many Web Services. Most tests involve the programmer running a few tries with a tool like Postman.
Now it’s time to answer the questions we asked at the beginning of the chapter.
“What is API Monitoring?”
We may answer this question as “It is the name given to the job of monitoring API/Web Services, constantly checking whether they return the expected responses in expected times, and notifying the relevant parties by running predefined tasks (such as sending e-mails or SMS, creating alarms) in case of any disruption.”
“Is API Monitoring really necessary?”
First of all, ask yourself these two questions:
If you answered “Yes” to any of these questions. API Monitoring is required or even mandatory. Because, if you are not aware of any disruption and do not solve the problem in some way, e-mails, phone calls, and complaints that can reach the upper management levels begin to rain down depending on the criticality of the business. Frequent occurrences of such situations and having no solution or being too late may disrupt business, and consequently loss of credibility, prestige, customer, or money.
Now it’s time to explain how to do this. If you remember the definition, there are two parts to the work. Let’s look at these.
In the first part, monitoring/listening and detecting any problems are being done. We can roughly specify the methods used in 3 groups.
It works with the logic of sending pre-prepared requests to the API/Web Service to be monitored at regular intervals and verifying the returned responses. I tried to summarize it with the following image:
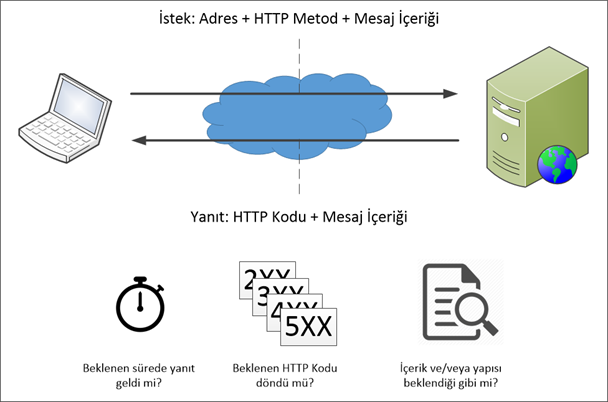
If you notice, there are two steps here. In the first step, we will send a request; in the second step, we will verify the returned response. Let’s take a closer look at these steps:
Step 1 — Submitting a request
Now the questions are: Where do we send the request? While developing API/Web Service, will we do special development for it? If we haven’t done it or we haven’t developed the service, how will we monitor that service?
Sending a request to a specific method (e.g. /healthCheck) prepared for this purpose: In this method, a special method is added while the API/Web Service is being developed and a simple HTTP 200 (meaning “everything is fine”) response is returned to requests to this method. Thus, you can find out if the API/Web Service is up at any time by sending a simple request. The method name is up to you. Generally, names such as /health, /healthcheck, /ok, /status, /check are used.
Although it is the most widely used method in active monitoring, there is one point that is often overlooked: this method can only detect that the API/Web Service is up, but not the crash of any of its methods. For example, this method is insufficient for scenarios 1, 3, or 6 of the scenarios I have listed above.
Sending requests to selected methods: The most critical methods (all methods, if you want) are selected and a separate monitoring definition is made for each. A monitoring definition consists of the request message to be sent specifically to that method and the validation method(s) prepared according to the response that the method is expected to return. Situations where the Web Service is up but one or more of the methods are problematic can also be caught with this method (such as scenarios 1, 3, or 6). You may think that sending requests to every method may cause performance loss. However, a few requests per minute or every few minutes will not affect the performance of your services much. On the other hand, catching a possible glitch immediately will save you from much more serious problems. Perhaps the most important point in this method is that the requests to be sent to the methods that update the data must be well thought out.
Sending requests to methods in order: Sometimes, to test whether the service is working as expected, you may need to call several specific methods one after the other and/or send a request by parameterizing the value returned by one method to the next method. Depending on the logic, the responses returned are tried to be verified at the end of each step, at the end of one or more selected steps, or at the end of the entire flow. Although it is a more complex and less used method than others in terms of design and implementation, it may make sense for some specific scenarios.
Step 2 — Response Verification
You submitted the request. Now it’s time to verify the returned response. For this, we can roughly give the following methods:
Timeout: The response must be returned before validation can take place. If the service or method cannot return a response, we cannot wait forever. This means that a response should be returned within a certain time (for example, 30 seconds).
I would like to draw attention to the fact that it is useful not to rush to make a decision while verifying the timeout. Sometimes a request we send may time out, for example, due to a temporary slowdown in the network. Sounding alarms immediately on the first error (I’ll explain in a moment) is of course an option. But if the problem is temporary and will be fixed on the second try, you may have set a false alarm. The server is up, its services and methods are working properly, and you may have gotten someone (perhaps yourself) into a fruitless search for bugs due to a momentary network slowdown. However, if you had tried one or two more times (of course there should be a limit, for example, try at most 3 or 5 times), maybe the problem would not recur and false alarms would not occur. If the same problem persists as a result of these attempts, sound the alarms at the highest volume with peace in mind, there is a problem with your service!
HTTP Status Code: Web Service responses contain an HTTP code (for details, see here). HTTP codes are 3-digit numbers, some of which are commonly used and understood alike. For example, 200 means “OK/Everything is OK”, 400 means “Bad Request”, 404 means “Page Not Found”, 500 means “Internal Server Error”. By defining new codes for your services, assigning special meanings to them, and explaining what is in the documentation, you can effectively use HTTP codes to return meaningful messages to clients.
In this verification method, it is checked whether the HTTP code returned is the expected code. For example, if the request method is expected to return the code 201 but returns 500, it is understood that there is a problem with that method.
Response Content and Its Structure: You submitted a request. A response was returned before the specified timeout period expired. The HTTP code of the returned response is also as you expected. So, does the returned message have the content you expect or a message in the structure you expect? Maybe there is a bug in the code that you are not aware of and it is returning the correct HTTP code but the wrong content. This situation also needs to be checked. For this, it is checked whether all or a part of the message is in the content or structure you expect.
It might be more accurate to call it “listening”. This method does not rely on you sending requests to API/Web Services but waiting for requests from them. The good thing is, in this method, you can also monitor the systems that cannot (unable to) open any service.
Let me try to explain the logic behind the work with an example. Let’s say a relative of yours -maybe your child- is going to another city/country and there is no phone number where you can reach him. So when you feel like saying, you cannot just say “Wait, let me call him. Is he okay? Is he in a good mood? Is he healthy? ” What would you do in this case? “Son, call us every few days and let us know how you are.” you may say. If you’re a somewhat fussy parent, you may keep an ear to the phone all the time. I went to boarding high school. There were no cell phones back then. There were car phones the size of a toolbox, but naturally, I didn’t have them, and that was exactly the case. 🙂

This is how passive monitoring works. You create a custom Web Service or method for each system you want to monitor (it could be an API/Web Service or a legacy application) and it just gives its address to the system you are watching and you expect it to send requests to this service or method periodically (for example, this can be done easily with cron + curl). It is enough that the request just keeps coming, you don’t even need to respond. As long as the system you are monitoring can send requests, everything is fine. It means that the system works properly. If the request does not arrive within the timeframe you set, you may conclude that there is a problem with the system you are monitoring.
One way to monitor your API/Web Services or clients is to examine the logs of incoming and outgoing messages. This method should not be considered independently of API Analytics (which is the subject of my next article), but as it is essentially a monitoring job, I find it right to describe it here.
It is possible to monitor how well the services are working by constantly examining the logs. The records of request/response traffic can be periodically filtered through HTTP codes, response time, content, sender IP, user, error code, accessed method type, message size. Values found by filtering through similar criteria can be compared with predetermined threshold values. Thus, unexpected situations can be caught and the relevant people can be notified.

If an API/Web Service is no longer accessible because there is a problem with the server, a method is malfunctioning, or an old application you are listening to is no longer sending a request to you, it is not possible to programmatically produce a solution. The best thing to do in this situation is to sound the alarm and notify the relevant people in some way.

At first glance, this is pretty simple. For example, you can send an e-mail to the addresses you have previously registered or send an SMS to phone numbers. However, this may not be enough. If you are using a Call and Alarm Management application (e.g. Opsgenie, PagerDuty), it will be more effective to create an alarm directly in that application. You can also make a record in the database of an application you have previously developed for similar tasks within the institution/company. Any or all of these can be done. If you are going to install the API Monitoring mechanism, it is useful to design a flexible structure and pay attention to the fact that new notification methods can be easily added.
Another issue that I did not mention above -but you will find very useful in real life- will be the storage of all monitoring, verification, and alarm logs. Because in the end, it is not enough to report a problem, you also need to keep records. It will be necessary to look at information such as when the problem occurred, in which method of which service was it, what request was sent, what response was received, why the answer was wrong, and who was notified about this situation by what method.
Another very important benefit of logs is that if the problem is not caused especially by you, but by another service that you are a client of, it helps you to prove it. Knowing that the responsibility is not yours but someone else’s will at least reduce your stress. 🙂
The common problem with logs is that the number of logs grows too fast. Therefore, it is useful to set a retention period for the logs and delete the records that have passed a certain period. Of course, that’s up to you. If you have enough disk space or you don’t want to delete the logs, that’s your business.
API Monitoring is indispensable in many cases for the smooth operation of the work. However, I do not recommend that you sit down and write code and try to deal with the issues I have mentioned here one by one. Because then you would have written an API Monitor application. If this is not your real job, it will be more efficient and cheaper to get one of the existing API Monitoring applications instead of embarking on such a big work.
As the Apinizer team, we also have an API Monitoring product. One of the best aspects of Apinizer API Monitor is its direct integration with Apinizer API Gateway (if you haven’t read it yet, I suggest you take a look at my previous article). You can use it as a part of your platform, not as a separate application. Thus, while defining API Proxy, you can easily define and manage your monitors, convert the definitions you created for testing into monitor definitions immediately, and use the log queries you prepared for analytics for monitoring purposes.
See it in action now: https://demo.apinizer.com
Input your search keywords and press Enter.